The Leaky Bathtub Problem: Why Not Focusing on Retention is Killing Your Growth
Two companies.
- Company A acquires 200,000 new users a month, retaining 55% of them long-term.
- Company B acquires 500,000 a month (2.5x more), retaining only 5%.
At six months, Company B leads: 985,000 active users vs. Company A's 790,000.
By year three, Company A grows to have ~3 million more active users than Company B.
The difference isn't a higher acquisition budget (Company B acquires more new users per month). Growth isn't necessarily an acquisition problem — it's a retention problem.
1. Think of Growth as a Bathtub
Most growth teams think in funnels: awareness → consideration → conversion. The funnel is useful for acquisition, but growth is a system that doesn't stop at the first conversion.
Want to learn more about stocks, flows, and systems? Checkout my deep-dive on the classic "Thinking in Systems"
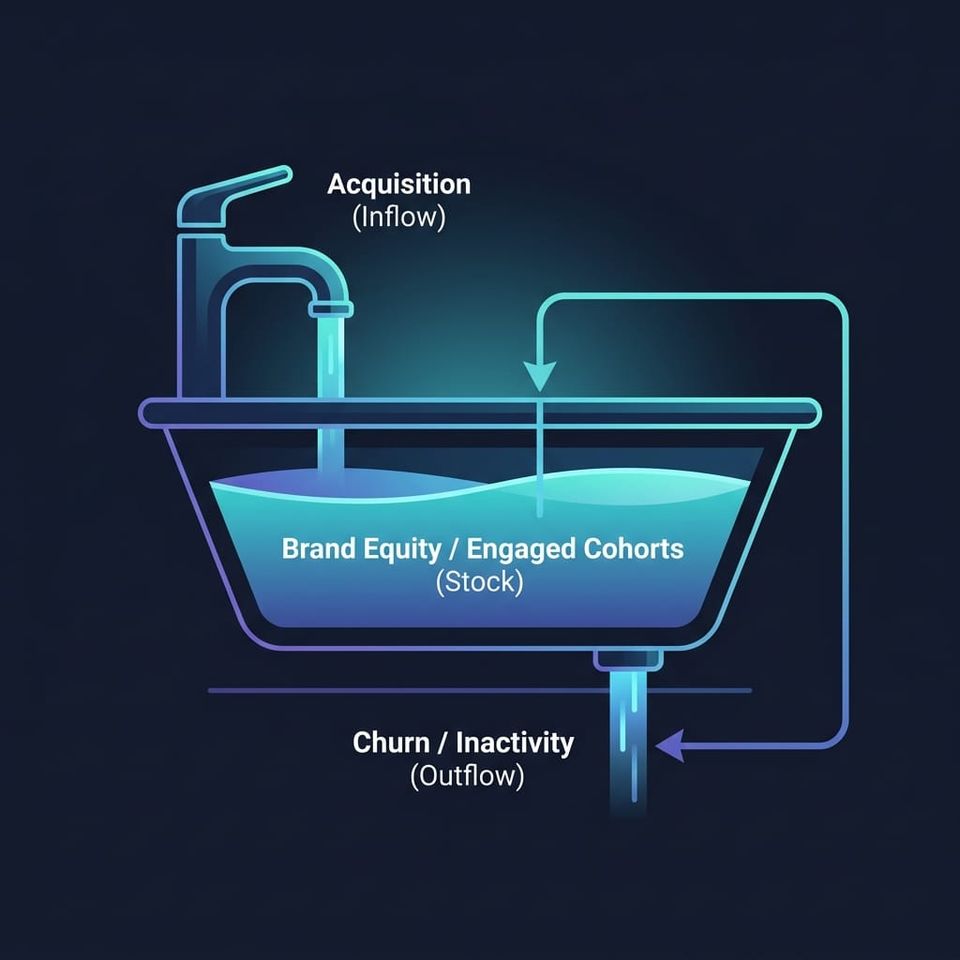
A useful analogy is to think of growth as a bathtub.
- The Water Level (Stock): Your active, engaged user base; the compounding asset that generates revenue, word of mouth, and long-term value.
- The Faucet (Inflow): Customer acquisition. Paid ads, seo, virality, etc.
- The Drain (Outflow): Churn and inactivity. Users who stopped using the product.
The water level in the bathtub can only rise if the faucet adds water faster than the drain removes it, and it will always be draining.
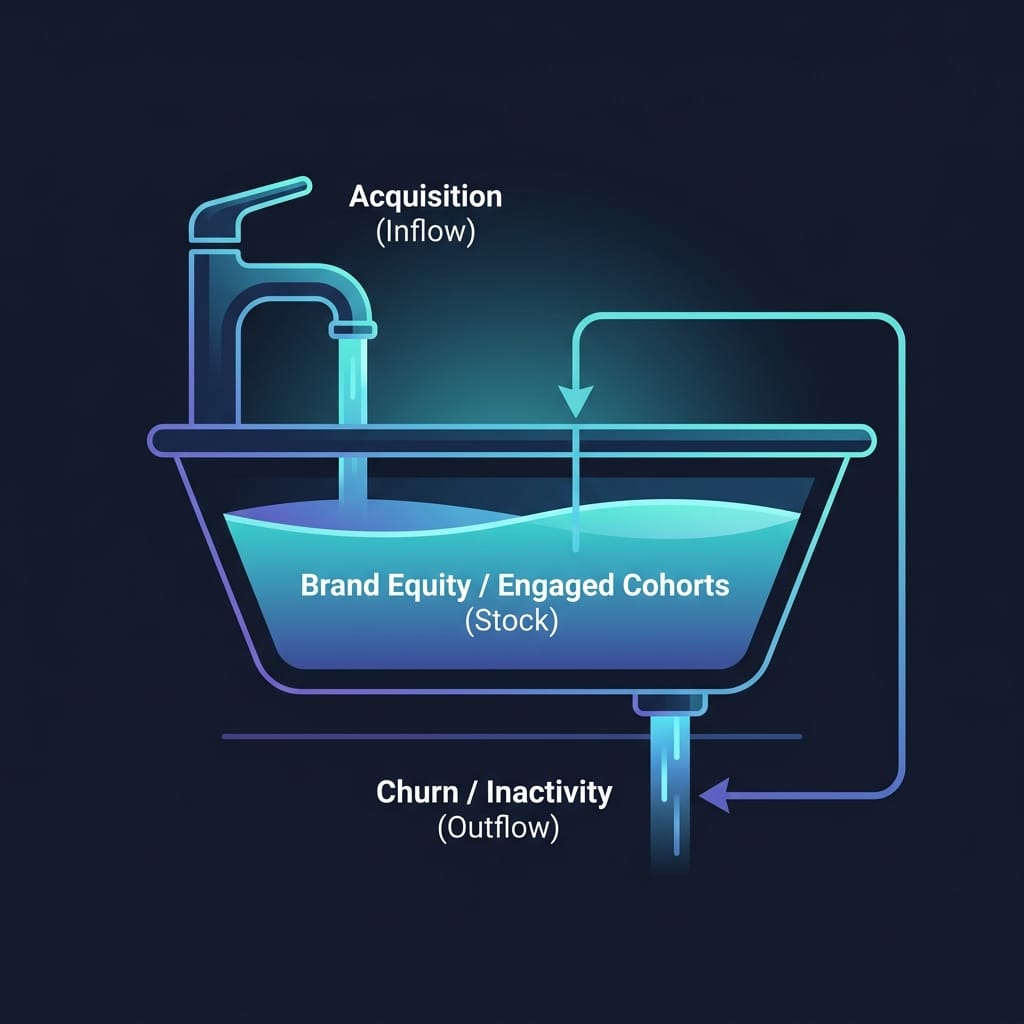
Furthermore, a natural reaction to a slow down in active customers may lead you to crank up the faucet (more ad spend, more emails, etc).
But if you have a leaky drain (poor retention), cranking up the faucet might just trigger an unsubscribe feedback loop. If you are too aggressive, and your customer is not retained and engaged, it feels like spam and widens the drain even further.
The only durable way to raise the water level in this situation, is to first shrink the drain.
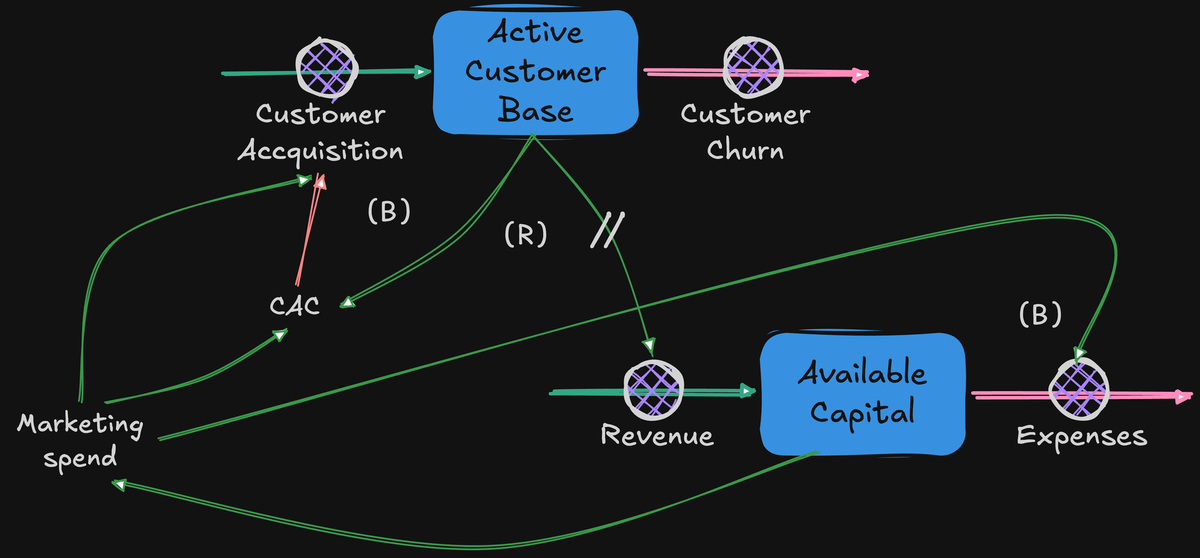
2. Retention as the Power Plant
Retention and engagement aren't just metrics to monitor; they are the drivers of both acquisition and monetization.
Retention powers acquisition:
- It fuels growth loops. Retained users generate more viral touchpoints, more content, more referrals. A 10% increase in where retention flattens can yield tens of thousands of additional users over 12 months — from a single cohort.
- It builds competitive muscle. Higher retention → higher LTV → higher affordable CAC. If your cohorts stick, you can outbid competitors on paid channels and afford strategies they can't. Cohorts also return their acquisition cost faster, so you can reinvest that capital into growth sooner.
- More retained users also means more monetization touchpoints. More renewals, more transactions, more ad impressions, which compounds revenue without additional acquisition costs.
To harness this engine, you must first be able to see it. That requires moving past vanity metrics and learning to measure retention through the lens of cohorts and curves.
3. Measuring Retention: Cohorts and Retention Curves
You typically measure retention through cohorts.
A cohort is a group of users who activated in the same time period (e.g., January). The standard tool for tracking them is a cohort retention table.
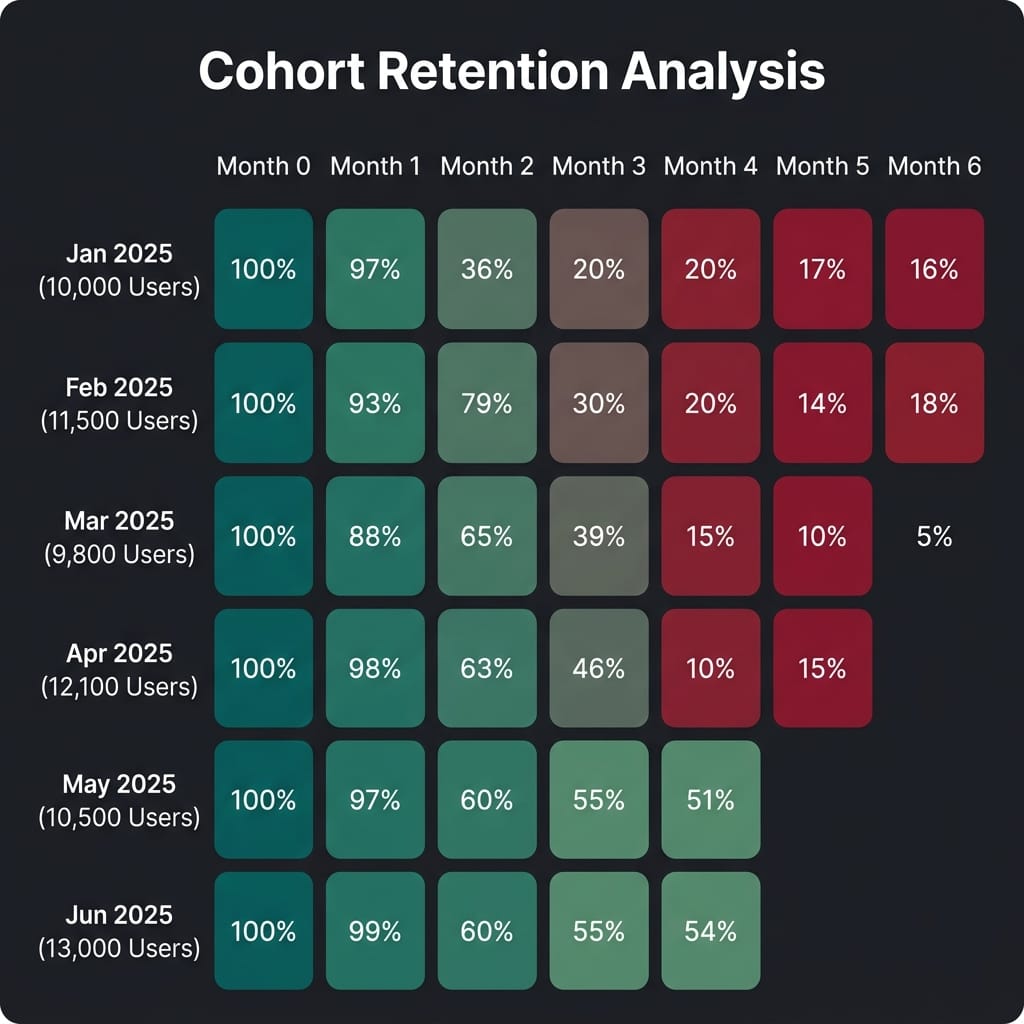
In a healthy product, we expect later cohorts to stay "greener" for longer.
As shown in the table above, early cohorts decay rapidly, leaving only 5–20% active by Month 6. But later cohorts stabilize at 50–55% active. This visual shift represents product improvements successfully taking hold.
When you plot these averages over time, they trace one of two primary shapes:
- The Trend to Zero: The curve slopes continuously toward the X-axis. You eventually lose most of your users.
- The Flat Line / Smiley: The curve drops initially, then flattens. A stable percentage of users remains active indefinitely.
If we stack these cohorts month after month like a layer cake, the compounding effect of the flat line becomes clear:

- On the left (Trend to Zero): Each cohort evaporates. Total active users spike initially but then "shark-fin" back down. You must continuously buy new users just to stay flat.
- On the right (The Flat Line): Each cohort establishes a permanent floor. Every new cohort layers on top of the last, compounding active users.
The CAC:LTV Payback
Let’s attach numbers to these curves. Assume both companies spend $25 CAC per user, with a gross margin of $5 per active month:
- Trend to Zero: Average lifetime of 2.32 months → LTV of $11.60. This cohort never pays back its CAC. Every dollar spent on acquisition is a net loss.
- Teal Cohort: Average first-year lifetime of 7.25 months → LTV of $36.25. The CAC is paid back in Month 5, and the 55% retained continues to generate profit indefinitely
4. The Measurement Problem: Adapting Retention to the Use Case
If you track the wrong action, your charts will show a beautiful, flat line that hides a dying product. To build a realistic retention metric, you must align your tracking with the natural behavior of your product.
Nature vs. Nurture
Every product has a nature component — the inherent frequency in which users experience a problem you solve. A messaging app is naturally daily. A tax tool is naturally yearly.
Your marketing and lifecycle campaigns are the nurture component — manufactured touchpoints designed to build habits.
Ideally, you want features and use cases that lie inside the habit zone:
- The Habit Zone (Monthly or more frequent): Because the frequency is high, it is easy to keep users engaged and top-of-mind.
- The Forgettable Zone (Less frequency than monthly): Because the natural frequency is low, users are prone to forgetting the product. You risk having to reacquire them every time they return.
Nurture must match nature.
If you send daily push notifications for a quarterly product (like travel booking), it feels like spam, driving users to uninstall. If you nurture quarterly for a Habit zone product, you may be forgotten.
If you are in the Forgettable Zone, you must either accept a longer measurement window or systematically layer on higher-frequency use cases (e.g., Zillow layering "checking home value" on top of "buying a home") to pull users into the Habit Zone.
Defining the Metric: Frequency → Core Action → Who
To define your retention metric, answer three questions:
- What is the natural frequency? Validate your qualitative use-case hypothesis by plotting a usage histogram (active days in the last 28 days). Daily products should show a cluster around 20–25 days; weekly products cluster around 4–6 days; monthly products stack on the far left (1–2 days).
- What is the core action? This is the event that proves a user received value. For Slack, it is `Message Sent`. For Pinterest, it is not opening the app; it is saving a pin.
- Who is included? Combine the frequency, the action, and the actor into a branded internal metric (e.g., "Weekly Active Messagers" instead of "Weekly Active Users").
Case 1: Pinterest (Social/Content)
Pinterest's browsing use case has a weekly natural frequency (the alternative — flipping through magazines — happens about once a week).
- Wrong metric: Monthly Sessions. Easy to inflate with push notifications. Proves nothing about value delivery.
- Right metric: Weekly Active Re-pinners. This is the core action — the user found something interesting enough to save.
Case 2: Huel (E-commerce Subscription)
Huel has two distinct customer personas, which makes a single retention metric dangerous:
- The A-la-carte Buyer: Buys protein powder occasionally.
- Natural frequency: quarterly.
- Core metric: Quarterly Active Buyers.
- The Subscriber: Has a recurring order.
- Natural frequency: monthly.
- Core metric: Monthly Active Subscribers.
If you blend these into one average cohort, you get noise: your subscribers look worse than they are, and your one-off buyers look healthier.
You must segment them in your data and track them separately.
By separating these cohorts, Huel can align its nurture campaigns to the nature of their use case.
Fix the Floor First
Growth is not a linear march from acquisition to conversion; it is a dynamic system of stocks and flows.
If you scale acquisition before your retention curve flattens, you are doing more than wasting marketing budget—you are actively burning your addressable market. The aggressive emails, push notifications, and lifecycle campaigns you deploy to force a habit will feel like spam, permanently widening your drain.
Before you spend another dollar on acquisition or launch your next signup campaign, run your cohorts and ask three questions:
- Have we mapped the natural usage frequency of our use case (Habit vs. Forgettable Zone)?
- Are we measuring actual value delivery (the core action) or just vanity app metrics?
- Have we segmented our cohorts to avoid drawing a noisy, average curve?
Stop trying to outrun a leaky drain by cranking open the faucet. Find your flat line, stabilize the floor, and let the cohort math do the compounding for you.
Member discussion