Beyond Data-Driven: Why Your Analytics Might Be Lying to You
I've been reading one of those books where you keep having to put it down because your brain needs a minute to process what you just read.
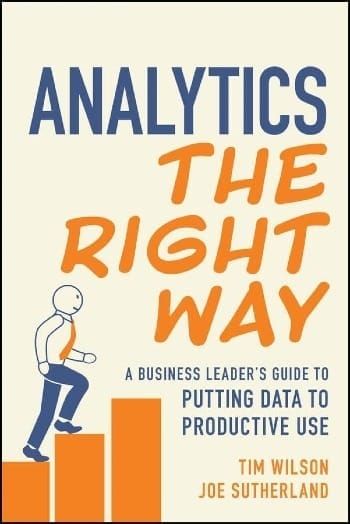
It's called "Analytics the Right Way" by Tim Wilson and Joe Sutherland, and I highly recommend it for anybody who regularly works with and must make decisions based on data.
Nowadays, everyone's always talking about being "data-driven" (I include myself on that list).
But are we?
When someone points to a chart that goes up and says it validates the millions spent on a marketing campaign, is that being data-driven? Or is that... wishful thinking with extra steps?
The book doesn't pull any punches on this stuff, and I can't do it justice in one post. I'm going to try to share some of the main ideas I took from it that completely changed how I think about data...
The Thing Nobody Wants to Admit: Uncertainty Never Goes Away
One of the main ideas in the book is the concept that, regardless of the amount of data available, uncertainty and risk cannot be eliminated. Ever.
The uncomfortable truth is that when we make decisions, we're all trying to predict the future based on the past. And the future? It has an annoying habit of being different from what came before.
The authors articulate this beautifully: "This is known as the Fundamental Problem of Causal Inference: we cannot go back in time to try something else and discover what would have happened. Instead, we can only try to predict what would have happened."
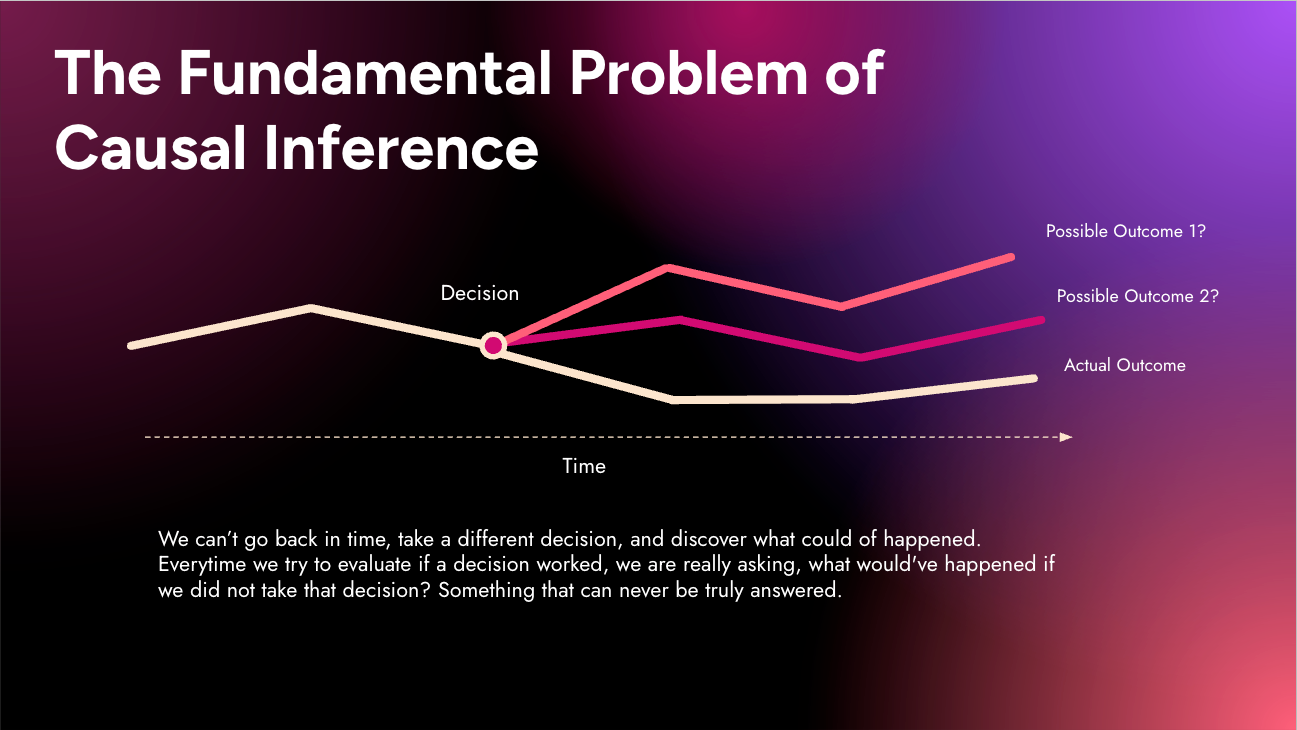
Stop and think about that for a second. Every time someone in your company says a campaign "drove" a 20% increase in sales, they're claiming an alternate reality they can never actually observe—the reality where that campaign never happened.
As the authors put it: "Looking at historical data, we know what we did and what happened, but we don't know what would have happened if we had done something else."
Why This is Not Just Philosophy
This isn't only a philosophical theory. It has real implications because it forces us to accept that, despite our best efforts, an action might not produce the outcome we wanted.
More importantly, understanding uncertainty can help us assess the full breadth of decisions that we might take by revealing the potentially significant downside risks associated with a decision.
The book provides a practical framework for thinking about this: instead of asking "Did our price cut cause sales to increase?", we should be asking two questions:
- Uncertainty: If we had not cut prices at all, what is the range of outcomes we might have observed?
- Causality: Is the outcome we observed after cutting prices significantly different from the average outcome we would have observed if we had not cut prices?
Good analytics for sound decision-making is about estimating all the ways things might end up, so that you can ultimately choose the option that best advances your cause.
The Insight Myth: Stop Waiting for Data to Talk
Insights aren't hiding in your data like treasure waiting to be discovered. They're created when human intelligence meets data. They come from asking the right questions, understanding the context, and making connections that aren't obvious in the numbers themselves. We need to approach the data with hypotheses, questions, and decisions that need to be made.
"We can't sit back and wait for 'insights' to wash over us so that we can select which ones seem ripe for supporting our decision-making. We must start with what decisions we need to make (and can make) and then go in search of data that will help us make those decisions better."
Facts vs. Insights: Why Most Dashboards Are Useless
As a data consultant, it's pretty standard to hear clients complain about their lack of insights. They want dashboards with infinite graphs and expect that by magically crossing a data point with a dimension, some insight will be found. However, the reality is that most of the time, these dashboards only deliver facts.
"Revenue attributed to Facebook ads rose 15% last month" is a fact, not an insight.
But watch what happens when you apply some human intelligence:
"The 15% revenue increase from Facebook ads coincided with our shift to video content in week 2, suggesting our audience responds better to the format. However, this was also back-to-school season when our target demographic historically increases spending by 12%. To validate whether the format change actually drove results, we should test video ads against static ones in November when seasonal effects are minimal."
See the difference? The insight connects facts to potential causes, acknowledges what else might be going on, and suggests what to do next. It moves from "what happened" to "why it might have happened and what we should do about it."
The critical point: "The actionability of insights comes from our ideas, not from the insights themselves."
The Data for Business Value Loop
Once you accept that uncertainty is a permanent aspect of life and that insights require human creativity, you need a practical way to derive value from data.
The book gives you exactly that:
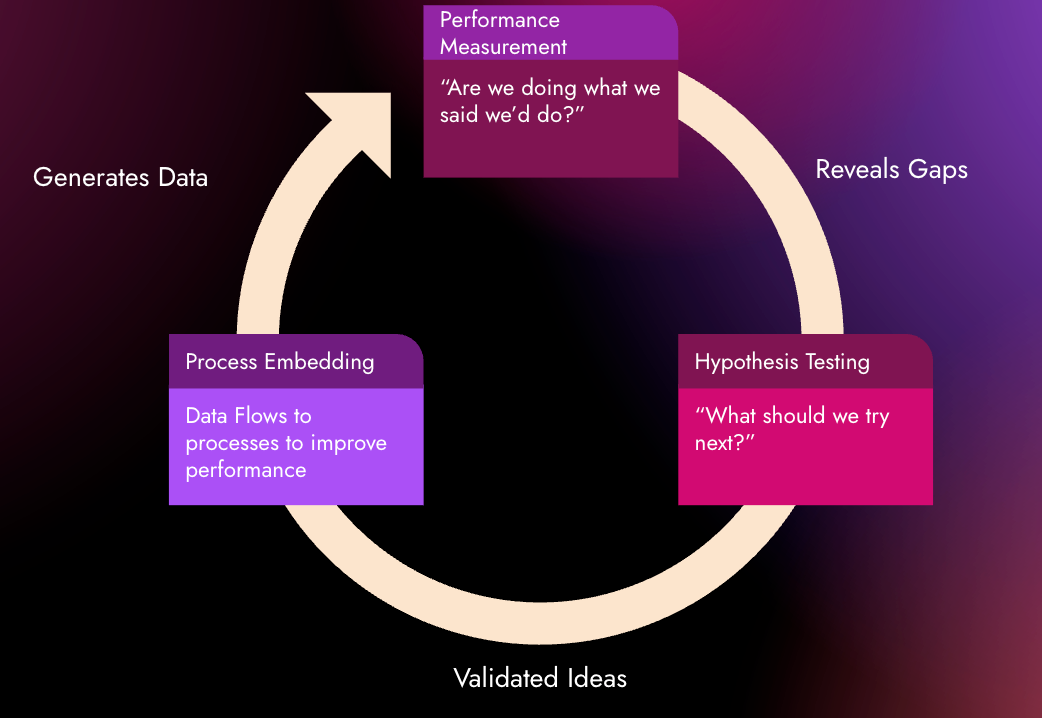
Performance Measurement → Hypothesis Testing → Process Embedding
Performance Measurement: Building a Time Machine
This is the "Are we doing what we said we'd do?" component. It's about setting expectations before you act, not after. Otherwise, you'll be left wondering, "Is the result good?"
The book describes this beautifully: "Think of performance measurement as being something of a time machine, in that we build a process where we think about the results that we expect to have in the future, and then, in the future, we compare the actual results to those expectations."
Performance measurement is essential, as it can help identify gaps and opportunities for improvement within the business.
The Two Magic Questions:
The authors provide a simple but powerful framework for setting up targets for your business strategy:
Magic Question 1: What are we trying to achieve? No metrics required here. This is about capturing why you're making this investment without getting trapped by what data you think you can easily measure.
Magic Question 2: How will we know if we've done that? Now you identify your outcome-oriented metrics and set targets.
The Challenge of Setting Targets (And How to Overcome It)
Setting targets is scary. Once you realize you need specific targets for meaningful KPIs, the whole process becomes daunting and easy to skip.
But here's the thing: for leaders focused on improvement, missing a target is actually an opportunity. Setting targets gets you past the "Is that good?" circles and straight to "What do we do next?" conversations.
The book offers two practical approaches:
- Wisdom of crowds: Get your key stakeholders to propose targets independently, then hash it out together
- Bracketing: Start with absurdly low and high numbers everyone agrees are ridiculous, then work toward something reasonable
You might end up with a range (a base target and a stretch target), and that's fine.
Outputs vs. Outcomes: A Critical Distinction
When setting a target, it's better to focus on the outcomes rather than the outputs.
- Outputs are directly impactable and countable things: how many emails were sent, how much traffic came to a website, how many "impressions" a digital advertisement garnered
- Outcomes are things that truly matter at the end of the day: how much revenue was generated, how many prospects are considering purchasing your products or services.
It's tempting to focus on outputs because they're easier to impact and measure. But outputs are just a means to an end. If they don't drive outcomes, you're just playing with vanity metrics.
Hypothesis Testing: The "What Should We Try Next?" Engine
Performance measurement tells you what needs attention, but it doesn't tell you what to do about it. That's where hypothesis testing comes in.
Building Hypotheses That Actually Work
The book gives you a specific structure:
"We believe [some idea] because [some evidence or rationale]. If we are right, we will [make some decision or take some action]."
This ensures three things:
- The Idea: What you want to test
- The Theory: Why you think it might be true
- The Action: What you'll do if you're right
The Evidence Ladder: Know What You're Working With
Not all evidence is created equal. The book outlines three levels:
At the bottom: anecdotal evidence: individual observations that might spark ideas but shouldn't drive major decisions alone.
In the middle: descriptive evidence: patterns in historical data that suggest relationships but don't prove causation.
At the top: scientific evidence: conclusions from research specifically designed to test hypotheses through controlled experiments.
Understanding where your evidence sits helps you figure out how much confidence to place in your hypotheses and how much to invest in testing them. Strong scientific evidence might justify immediate action, while anecdotal observations probably need more validation first.
Of course, the higher up the ladder you go, the more time and money it costs.
Not every decision needs scientific evidence.
Data as Process Embedding: When Data Becomes Operational
This refers to utilizing data to optimize operations. When your CRM automatically triggers an email based on customer behavior, or when your predictive model creates an audience for the ad platform of users highly interested in a particular product category.
Some hypothesis testing results in data getting baked into your processes. Then you measure that through performance metrics, and the whole loop starts over.
The Reality Check: Most Analytics Is Broken
The book doesn't just provide frameworks; it also explains why much of what passes for analytics is misleading.
A sobering stat: the authors suggest that 80% of analyses showing two things are related by plotting lines that move together over time are fundamentally flawed.
The main culprit?
Confounding bias: When we misattribute what's causing what due to a third factor.
A classic example: ice cream sales and crime rates both go up in summer. It's not because ice cream causes crime. It's because summer causes both.
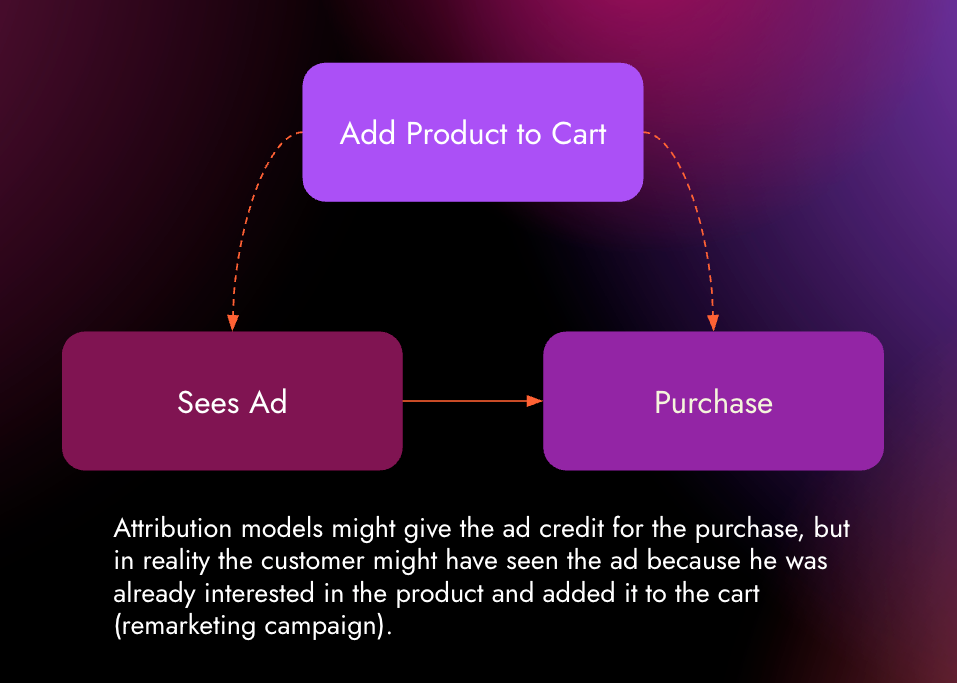
This shows up everywhere, especially in marketing attribution. Customer clicks ad, then makes purchase—so the ad gets credit. But what if they'd already decided to buy, and the ad just happened to arrive at the right time? The causal arrow might be backwards.
Where This Leaves Us
Reading this book was one of those experiences that makes you realize how much you thought you knew but actually didn't. It's not about having more sophisticated tools or bigger datasets. It's about being more honest about what we don't know and more disciplined about how we learn.
The path forward isn't complicated, but it requires some uncomfortable truths:
- Uncertainty never goes away, so stop pretending it will
- Insights come from human intelligence, not from crossing data points
- Set expectations before you act, not after
- Focus on outcomes that matter, not outputs that are easy to measure
- Question everything, especially the relationships that seem obvious
For all the talk about being "data-driven," maybe what we really need is to be more thoughtful-driven. The data is just there to help us think better, not to think for us.
That might not sound as sexy as "let the data speak," but it's a hell of a lot more honest. And in the end, it's probably what separates the organizations that actually get value from their data from the ones that just have really impressive dashboards nobody looks at.
Member discussion